Acquisition timeline
Find available dates and distinguish usable from cloud-affected scenes.
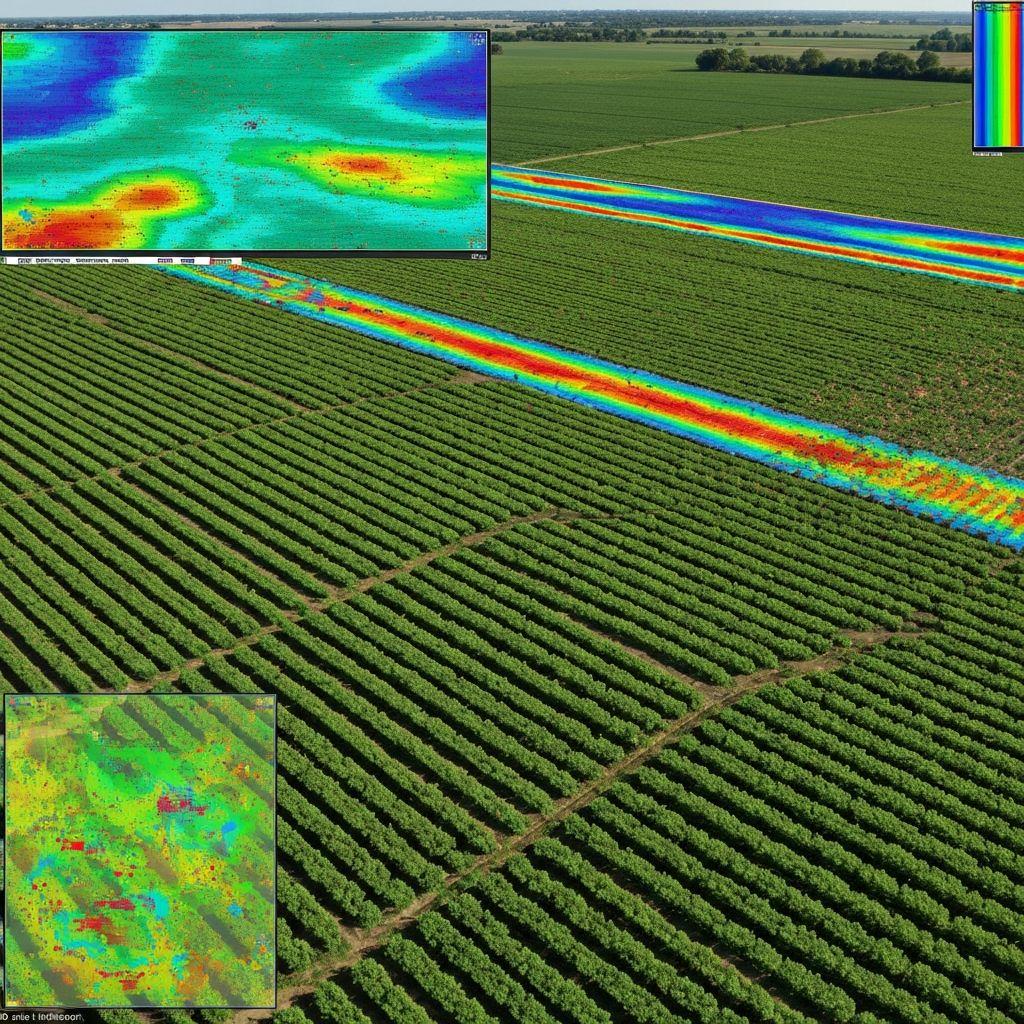
What it covers
Find available dates and distinguish usable from cloud-affected scenes.
Compare natural-colour and analytical views across dates.
Focus imagery and statistics on the selected boundary.
Workflow
Use verified boundaries and choose a monitoring period.
Combine usable satellite acquisitions with relevant weather context.
Review indices, field zones, and change against earlier dates or seasons.
Prioritize scouting, document observations, and plan the next action.
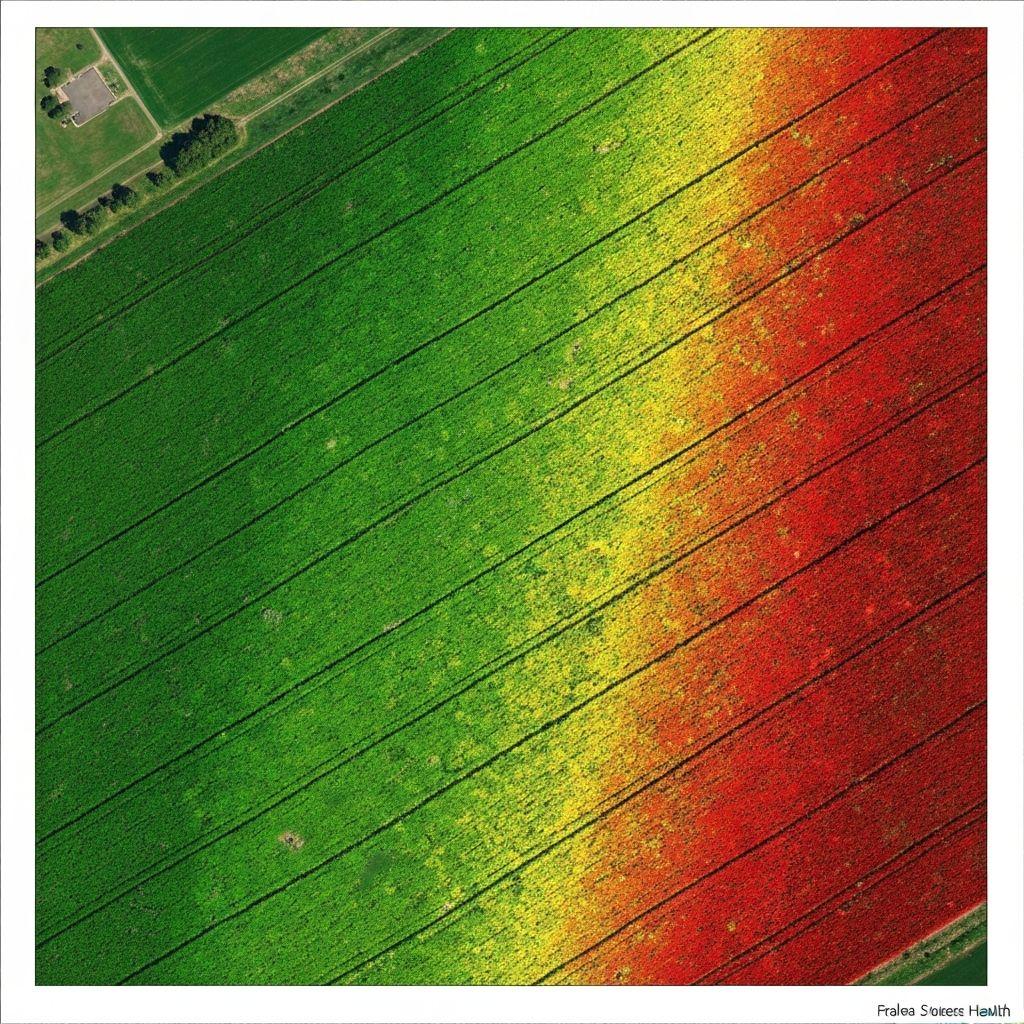
 Outputs
Map-ready observations for a selected date.
Visual evidence of change between acquisitions.
Remote-sensing indicators describe observed surface conditions; they do not diagnose a crop problem on their own.
Create an account or sign in to explore the available Earthasoft workflow.
Create an account